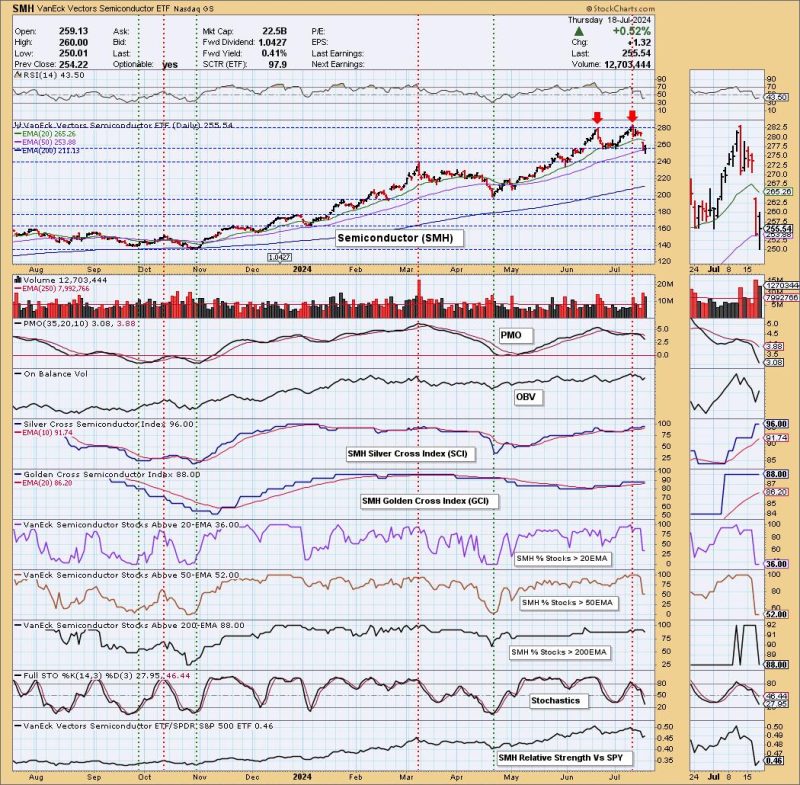
The semiconductor industry has been experiencing significant fluctuations in recent times, with the SMH ETF showing signs of a potential double top formation. Double tops are common technical patterns that can signal a trend reversal and are closely watched by traders and analysts alike.
In technical analysis, a double top occurs when an asset’s price reaches a peak, retraces, and then attempts to reach the same peak again before reversing course. This pattern is often seen as a bearish indicator, as it suggests that the asset is struggling to surpass a previous high and may be losing momentum.
In the case of the SMH ETF, the formation of a double top could indicate that semiconductor stocks are facing resistance at a certain level, potentially leading to a downturn in the near future. Investors and traders monitoring this pattern may take it as a signal to reassess their positions and consider the possibility of a trend reversal.
It is important to note that technical patterns like double tops should not be relied upon as standalone indicators for making trading decisions. Other factors, such as fundamental analysis, market sentiment, and global economic trends, should also be taken into consideration when evaluating the outlook for semiconductor stocks.
The semiconductor industry is known for its cyclical nature, with periods of rapid growth often followed by periods of consolidation or decline. Understanding technical patterns like double tops can help investors navigate these market cycles and make informed decisions about when to buy, sell, or hold semiconductor stocks.
In conclusion, the appearance of a double top pattern on the SMH ETF suggests a potential trend reversal in semiconductor stocks. Traders and investors should monitor this pattern closely and consider the broader market context before making any decisions. By combining technical analysis with other forms of market research, individuals can better position themselves to navigate the ups and downs of the semiconductor industry.
