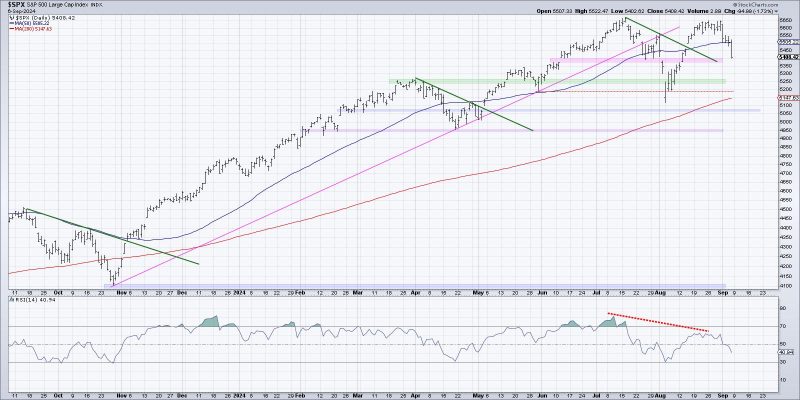
Chart Analysis: Identifying Warning Signs of a Market Top
Chart analysis is an essential tool that traders and investors utilize to identify potential turning points in the market. In this article, we will dive into three key charts that are currently showing warning signs of a possible market top. By understanding these indicators, investors can make informed decisions to protect their portfolios and navigate uncertain market conditions.
Chart 1: The S&P 500 Index
The S&P 500 index is a widely followed benchmark for the overall stock market performance. When analyzing the S&P 500 chart, one key indicator to watch is the moving averages. In particular, the relationship between the 50-day and 200-day moving averages can provide valuable insights into market sentiment.
If the 50-day moving average crosses below the 200-day moving average, it is often seen as a bearish signal, indicating a potential shift in the market trend. Currently, we are observing the 50-day moving average approaching the 200-day moving average, suggesting a possible trend reversal. This convergence could signal a weakening market and caution investors to reevaluate their positions.
Chart 2: Volatility Index (VIX)
The Volatility Index, also known as the VIX, is a measure of market expectations for near-term volatility conveyed by S&P 500 stock index option prices. A rising VIX typically indicates increasing market uncertainty and potential downside risk. Monitoring the VIX chart can help investors gauge market sentiment and risk appetite.
Recently, the VIX has been trending higher, reflecting growing concerns among investors about market instability. Elevated volatility levels often coincide with market peaks, as heightened fear and uncertainty drive investors to seek protection. As the VIX continues to climb, it serves as a warning sign of a possible market top and prompts investors to adopt defensive strategies to safeguard their portfolios.
Chart 3: Sector Rotation
Analyzing sector rotation patterns provides insights into where market participants are allocating capital and which sectors are leading or lagging. A significant shift in sector leadership can hint at broader market shifts and potential turning points.
Currently, we are observing a divergence in sector performance, with defensive sectors such as utilities and consumer staples outperforming cyclical sectors like technology and consumer discretionary. This defensive sector rotation is characteristic of risk-averse behavior among investors as they seek refuge in stable and resilient sectors during uncertain times.
Conclusion
In conclusion, chart analysis plays a crucial role in identifying warning signs of a market top and guiding investor decisions. By closely monitoring key indicators such as moving averages, volatility levels, and sector rotations, investors can stay ahead of market trends and position themselves strategically in changing market environments. Being proactive in analyzing charts and interpreting market signals empowers investors to make informed decisions that protect their portfolios and capitalize on market opportunities.
