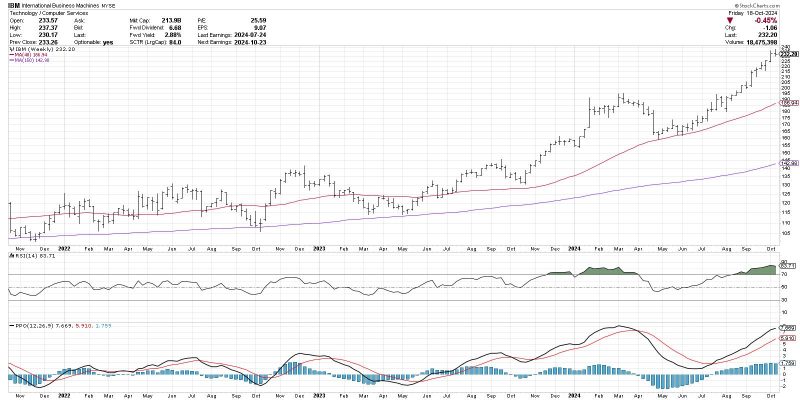
The Moving Average Convergence Divergence (MACD) histogram is a popular technical indicator used by traders to identify potential trend changes in the financial markets. When analyzing market trends, traders often rely on a combination of technical indicators to confirm signals and make informed decisions. The MACD histogram, a derivative of the MACD indicator, is one such tool that offers unique insights into market dynamics.
At its core, the MACD histogram is constructed by subtracting the slow exponential moving average (EMA) from the fast EMA of the MACD line. This calculation results in a visual representation of the difference between these two EMAs and is plotted as a histogram that fluctuates above and below the zero line. Traders often monitor the MACD histogram for crossovers above or below the zero line, which can signal changes in market momentum and potential trend reversals.
One of the key strengths of the MACD histogram is its ability to provide early signals of potential trend changes. By capturing the divergence between two moving averages, the histogram can identify shifts in market dynamics before they are reflected in price action. This early warning system is particularly valuable for traders seeking to enter or exit positions at optimal levels.
In addition to identifying trend changes, the MACD histogram can also be used to confirm the strength of a prevailing trend. When the histogram values are increasing in magnitude, it indicates that the momentum of the trend is strengthening. Conversely, decreasing histogram values suggest a potential loss of momentum and a weakening trend. Traders can use this information to adjust their trading strategies accordingly.
Another important aspect of the MACD histogram is its ability to provide convergence and divergence signals. Convergence occurs when the histogram moves closer to the zero line, indicating a potential reversal in trend direction. On the other hand, divergence happens when the histogram moves further away from the zero line, suggesting a continuation of the current trend. By monitoring these signals, traders can anticipate potential market movements and adjust their positions accordingly.
While the MACD histogram is a powerful tool for anticipating trend changes, it is essential to use it in conjunction with other technical indicators and analysis methods for comprehensive market analysis. No single indicator can provide all the answers, and traders should consider multiple factors before making trading decisions.
In conclusion, the MACD histogram holds the secret to anticipating trend changes by providing early signals of potential reversals and confirming the strength of prevailing trends. Traders can leverage this versatile indicator to make informed trading decisions and stay ahead of market movements. By integrating the MACD histogram into their analysis toolkit, traders can enhance their ability to navigate the dynamic world of financial markets effectively.
