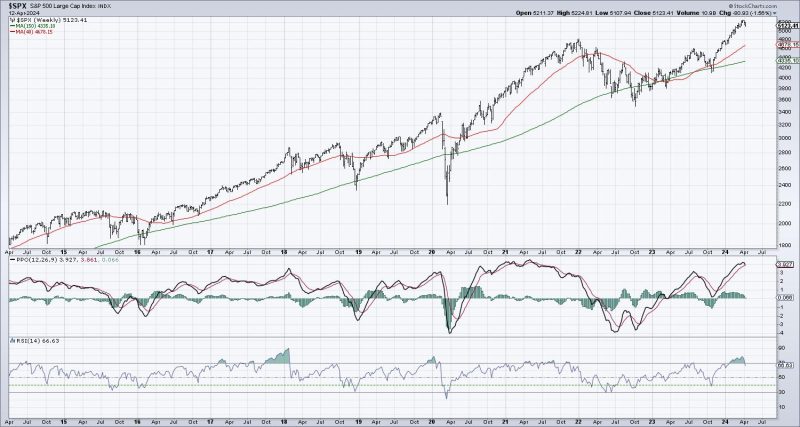
The S&P 500 Index, a key barometer of the U.S. stock market, has recently raised concerns among investors as it flashes major topping signals. These signals indicate a potential reversal in the market trend, prompting investors to reassess their asset allocation and risk management strategies. Let’s delve deeper into these topping signals and explore what they mean for market participants.
One of the critical indicators suggesting a possible market top is the bearish divergence in the Relative Strength Index (RSI). The RSI is a momentum oscillator that measures the speed and change of price movements. When the S&P 500 reaches new highs, but the RSI fails to confirm these highs by making lower highs, it indicates weakening upward momentum and a potential trend reversal. This divergence signals that the market may be losing steam, and investors should exercise caution.
Another concerning signal is the negative divergence between the index’s price and trading volume. In a healthy uptrend, increasing prices are typically accompanied by rising trading volumes, reflecting strong investor participation and conviction in the market rally. However, when the market rises on low trading volumes or declining participation, it suggests that the rally lacks broad support and may not be sustainable. This divergence could point to a potential market top, as investors become increasingly wary of the rally’s strength.
Additionally, technical analysis tools, such as moving averages and trend lines, can provide valuable insights into the market’s direction. A crossover of key moving averages, such as the 50-day and 200-day moving averages, or a breach of important trend lines, could indicate a shift in market sentiment and potential trend reversal. These technical signals are closely watched by traders and analysts to gauge the market’s health and to anticipate possible turning points.
Moreover, market valuation metrics, such as the price-to-earnings ratio (P/E ratio) and the cyclically adjusted price-to-earnings ratio (CAPE ratio), can offer clues about market frothiness and overvaluation. Elevated P/E ratios or CAPE ratios relative to historical averages may suggest that stocks are overpriced and due for a correction. When valuations reach excessive levels, investors should tread carefully and consider rebalancing their portfolios to mitigate downside risks.
In conclusion, the S&P 500 flashing major topping signals serves as a cautionary reminder for investors to monitor market dynamics closely and stay vigilant amid signs of a potential trend reversal. By paying attention to technical indicators, trading volumes, moving averages, and market valuations, investors can better navigate turbulent market conditions and protect their portfolios from substantial losses. As always, prudent risk management and a diversified investment approach are key to weathering market fluctuations and achieving long-term financial goals.
