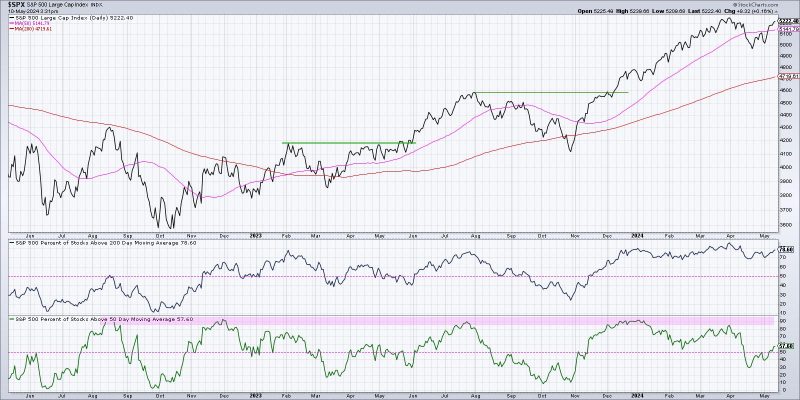
Breadth indicators are essential tools used by traders to confirm the strength and sustainability of a market trend. By analyzing various breadth indicators, investors can gain insights into the overall health of the market and make informed trading decisions. In this article, we will explore three key breadth indicators that can help confirm a bullish market trend.
1. Advance-Decline Line:
The advance-decline line is a straightforward breadth indicator that tracks the number of advancing stocks versus declining stocks in a given market. By comparing the number of stocks moving higher versus lower, investors can gauge the breadth of market participation. In a bullish market trend, the advance-decline line tends to move higher, indicating broad-based strength across multiple stocks. If the advance-decline line is rising along with the market indices, it can be a positive sign of a sustainable uptrend.
Investors can also look for divergences between the advance-decline line and the market indices. For example, if the market indices are making new highs, but the advance-decline line is failing to confirm these highs, it could signal underlying weakness in the market trend. Conversely, if the advance-decline line is making new highs ahead of the market indices, it may indicate strong market breadth and potentially signal a continuation of the bullish trend.
2. New Highs – New Lows:
Another important breadth indicator is the new highs-new lows indicator, which tracks the number of stocks hitting new highs versus new lows within a specific time frame. In a bullish market trend, investors typically want to see a higher number of stocks making new highs compared to new lows. This indicates a broad-based rally across various sectors and industries, reflecting overall market strength.
Conversely, if the number of stocks making new highs starts to decline while the market indices are still rising, it could suggest a weakening market trend. Investors should pay attention to any significant divergences between new highs and new lows, as they can provide valuable insights into potential shifts in market sentiment.
3. Bullish Percent Index (BPI):
The Bullish Percent Index (BPI) is a technical breadth indicator that measures the percentage of stocks within a specific market index that is trading on a buy signal. A high BPI reading suggests widespread bullish sentiment among market participants, indicating a strong uptrend. On the other hand, a declining BPI may signal diminishing bullish momentum and potential weakness in the market trend.
Investors can use the BPI to confirm the overall health of a bullish market trend. When the BPI is at elevated levels, it can provide confirmation that the market trend is robust and likely to continue. However, a declining BPI may act as a warning sign of a potential reversal or consolidation in the market.
In conclusion, breadth indicators play a crucial role in confirming a bullish market trend and providing valuable insights into market dynamics. By analyzing indicators such as the advance-decline line, new highs-new lows, and the Bullish Percent Index, investors can gain a better understanding of market breadth and make more informed trading decisions. By combining technical analysis with breadth indicators, traders can improve their ability to identify opportunities and navigate changing market conditions effectively.
